
Wealthfront 529 Education Savings Account
Introduction
This white paper provides an overview of the Wealthfront 529 College Savings Account, a tax-advantaged investment account designed to help families save for future education expenses. Wealthfront combines our automated investing technology with a state-sponsored 529 plan to deliver a low-cost, diversified, and user-friendly savings solution. The platform emphasizes long-term growth through passive investment strategies, personalized portfolio allocation, glide paths, and tax efficiency.
529 Education Savings Accounts
This section provides a high-level overview of some of the most important features and restrictions of 529 plans in general. For in-depth details and a comparison against other savings approaches, see our blog post comparing available options.
Tax Advantages
529 plans offer a more tax-efficient way to save for educational expenses than a traditional taxable investment account. The tax treatment of 529 accounts is similar in certain respects to a Roth IRA: Contributions are made with after-tax dollars, but growth and qualified withdrawals are not taxed. For example, earnings (dividends and distributions) from the underlying investments are not taxed when they’re received, and no tax is owed when you make a withdrawal from the account – as long as the withdrawal is being used to pay for “qualified expenses” (see details below).
529 plans are authorized under the federal tax code and each 529 plan must be sponsored by an individual state (Wealthfront’s plan is sponsored by the state of Nevada). Many states offer either a tax deduction or credit on contributions to 529 plans. These benefits typically only apply to plans sponsored by the state in which the contributors live, but there are a handful of states that offer a benefit for any 529 plan, regardless of the sponsoring state. If you live in a state that only offers tax advantages for in-state plans, these are likely your best option. There are no federal tax deductions or credits for 529 contributions.
Qualified Expenses
529 account funds can be withdrawn tax-free for a variety of qualified education expenses, including:
- Tuition and fees for eligible K-12 and college education
- Required books and supplies including computers and equipment
- Qualified post-secondary credentials such as information technology, health care, or construction trades
Certain expenses are subject to limits. Withdrawals for non-qualified expenses are allowed, but with some costs. You will pay income taxes plus a 10% penalty on the total gains of the funds withdrawn. There are some exceptions to this rule, including if the beneficiary dies, receives scholarships, or attends a military academy.
Excess funds from one plan can be “rolled over” into another 529 account for a different qualified family member (for example a parent, sibling, first cousin, or the account holder) without penalty.
Additionally, unused funds can be rolled over into a Roth IRA owned by the beneficiary of the 529 plan without taxes or penalties, under certain conditions:
- The account must have been opened for at least 15 years, and the rolled-over funds must have been deposited into the 529 account at least five years prior to the roll-over
- The beneficiary must have earned income (for examples, from wages) equal to or greater than the rolled-over amount
- No more than $35,000 can be rolled over during the beneficiary’s lifetime. As of 2026, the annual limit is $7,500 (or $8,600 if the beneficiary is over the age of 50). The annual limit may increase in future years, but the $35,000 lifetime limit does not automatically increase.
Contributions and Limits
Contributions to 529 plans can be made at any time. There is no limit on the frequency or number of contributions made per year.
However, contributions to 529 plans are considered gifts to the beneficiary, and are subject to limits before requiring a gift tax return. As of this writing, the annual gift limit to an individual is $19,000 per year. Married couples can contribute $19,000 each without triggering the tax return requirement, for a total of $38,000 per year. There is no income limit for account owners or beneficiaries (unlike, for example, Roth IRAs whose tax treatment is similar to that of 529 plans).
529 plans offer a feature called superfunding, which allows up to five years of contributions to be made at once (i.e. $95,000 contribution by an individual or $190,000 by a married couple) based on the 2026 annual gift tax exclusion). To receive this treatment, the donor generally must file a federal gift tax return and elect to spread the contribution evenly over five years. The benefit of superfunding is you get the tax free benefit started sooner on a larger amount of money which typically improves your ability to afford paying for college. Additional gifts to the same beneficiary during the subsequent four years may require additional gift tax reporting and may reduce the donor’s available lifetime gift and estate tax exemption, but they will not necessarily result in gift tax being owed.
Each state also has a maximum allowable balance, which includes contributions as well as growth in the value of the account. The maximum allowable balance for Wealthfront’s plan is $575,000. No contributions to the account are allowed if the balance is above this limit.
Ownership Structure
529 plans have both an account owner and a designated beneficiary. The owner is often the parent or guardian of the beneficiary, but this isn’t required—you can open a 529 account with anyone designated as the beneficiary. As the account owner, you may change the beneficiary after the account has been opened. The account owner retains control over investment decisions and the withdrawal of funds even after educational expenses begin.
Wealthfront’s 529 Account
Wealthfront’s approach to 529 Plans reflects our broader investment methodology: building passive, low-fee, globally diversified investment portfolios to reduce unnecessary risk and maximize your chance of reaching your spending goals.
Wealthfront takes a personalized approach to 529 plans, with your investment plan tailored to the details of you and your beneficiary, including:
- The time until the plan beneficiary expects to begin college
- The type of college the beneficiary expects to attend (to estimate the expected total cost of education)
- Your income and investable assets
- Your personal tolerance to market fluctuations
This information is used to project your future income and asset growth, expected savings rate, and ability to meet the overall expense, which we then use to assign you a risk score on a scale of 0-10 and a corresponding investment plan and glide path. All else equal, a longer expected time until college, higher income and assets, and a higher indicated tolerance for risk will result in an investment plan containing more higher-risk and higher-return assets, though higher returns are not guaranteed. You are free to choose a risk score and investment plan other than the one we recommend. You may also change the risk score of your investment plan later, but, per IRS rules, you can only do so up to twice per calendar year unless you change the plan’s beneficiary.
Asset Classes and Investing Vehicles
Your Wealthfront 529 plan will invest in a selection of nine globally-diversified asset classes. 529 plans invest in special securities known as “municipal fund securities.” In Wealthfront’s 529 plans, these securities each hold a single low cost ETF representing a particular asset class. Your Wealthfront 529 account portfolio dashboard will display only the asset class; however, Table 1 shows the underlying ETFs used to represent each of the nine asset classes.
Table 1: Asset Classes and Underlying ETFs
| Asset Class | ETF Name and Ticker | Expense Ratio |
| US Stocks | Vanguard Total Stock Market ETF (VTI) | 0.03% |
| International Developed Stocks | Vanguard FTSE Developed Markets ETF (VEA) | 0.03% |
| Emerging Markets Stocks | Vanguard FTSE Emerging Markets ETF (VWO) | 0.06% |
| US Dividend Growth Stocks | Vanguard Dividend Appreciation ETF (VIG) | 0.04% |
| US Real Estate | Vanguard REIT ETF (VNQ) | 0.13% |
| US TIPS | Vanguard Short-Term Inflation-Protected Securities ETF (VTIP) | 0.03% |
| US Investment Grade Corporate Bonds | iShares iBoxx $ Investment Grade Corporate Bond ETF (LQD) | 0.14% |
| Emerging Markets Bonds | Vanguard Emerging Markets Government Bond ETF (VWOB) | 0.15% |
| US Treasury Bills | iShares Short Treasury Bond ETF (SHV) | 0.15% |
Building Portfolios
In constructing portfolios, Wealthfront applies Modern Portfolio Theory, or MPT, a method of selecting portfolios via mathematical optimization to balance risk and return which earned Harry Markowitz the Nobel Prize in Economics in 1990. The key idea behind MPT is the notion of an “efficient” portfolio – one whose expected return can’t be increased without taking extra risk, or whose riskiness can’t be decreased without also decreasing its expected return.
As inputs, we require two sets of estimated quantities:
- Expected returns of each asset class
- The covariance matrix of asset class returns
With these inputs, denoted by 𝜇 and 𝛴 respectively, we solve optimization problems of this form to construct efficient portfolios:
maximize: 𝜇′⋅𝑤
subject to: 𝑤′⋅𝛴⋅𝑤 ﹦ 𝜎²
𝑤 ⩾ 𝟢
𝑤′⋅𝟙 = 1
𝑤 ∈ 𝑊
where:
- 𝑤 denotes the asset class weights, which are being optimized
- 𝜎 is the target portfolio volatility. The expression 𝑤′⋅𝛴⋅𝑤 gives the expected annualized variance of the portfolio. The square root of this value is the annual volatility.
- The constraints 𝑤 ⩾ 𝟢 and 𝑤′⋅𝟙 = 1 mean that the portfolio can only take long positions, and its portfolio weights must sum to one (𝟙 is a vector of ones).
- 𝑊 represents a set of portfolios defined by extra constraints on the weights. “𝑤 ∈ 𝑊” means that the portfolio 𝑤 must satisfy these constraints. We add extra constraints including upper bounds on individual asset weights and constraints of the weights of certain pairs of assets relative to each other, to ensure diversification.
Wealthfront solves problems like this for a range of target volatilities to produce a set of portfolios that form the building blocks of our 529 investment plans. The portfolios range in risk from very conservative (high weights on bonds, especially Treasury bills) to aggressive (high weights on stocks).
Glide Paths
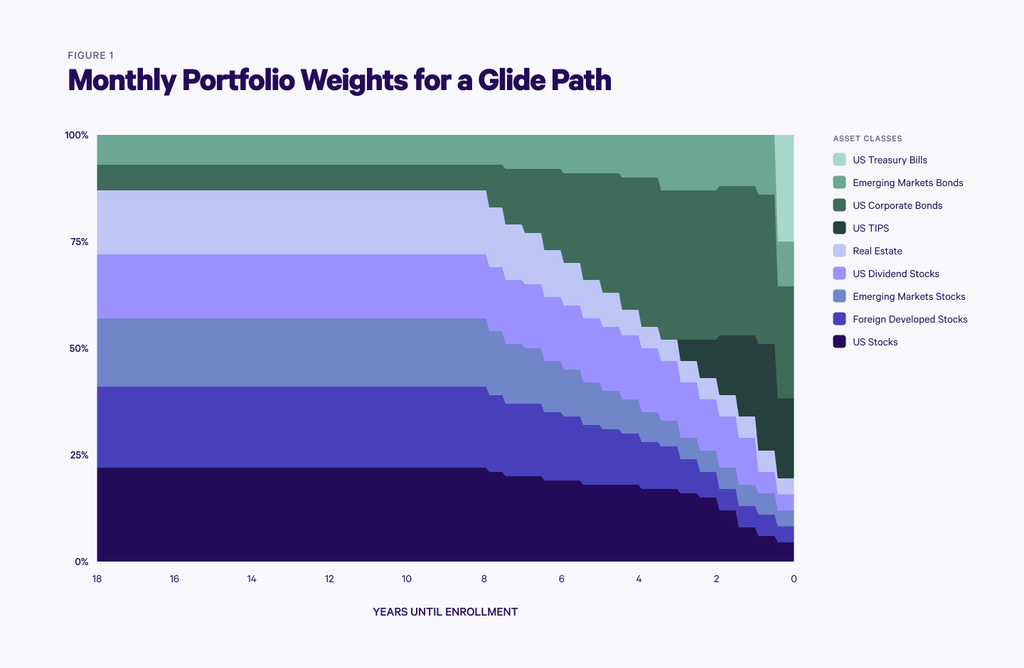
A distinctive feature of Wealthfront’s 529 plan is its use of glide paths—portfolio asset allocations that gradually decrease in riskiness as the plan beneficiary’s target withdrawal date nears—rather than a fixed set of portfolio weights for the entire investment period. The rationale for using glide paths is that earlier in the investment period, you have longer to go before expenses come due, so you have a better ability to withstand market fluctuations associated with a higher risk, higher expected return portfolio. As the time to pay expenses approaches, the effect of a market drop could be far more detrimental to the ability to cover expenses. So, the glide paths shift the construction of your portfolio from growth to capital preservation.
Each step along a glide path corresponds to a particular portfolio constructed using the MPT method described above. The portfolios in a glide path may change as often as monthly, but don’t typically change that often.
Figure 1 shows the portfolio allocations over time for a risk score 8 portfolio (the most commonly-chosen option). Note that the chart shows the entire 18-year glide path. If the beneficiary is older when the account is opened, the first investment plan would start with a portfolio farther along on the glide path.
Costs and Minimums
There are three categories of fees associated with Wealthfront’s 529 plan:
- An advisory fee of 0.25% of assets annually charged by Wealthfront
- Program management fees totaling 0.06% of assets annually, charged by Ascensus (the plan’s administrator), and the Board of Trustees of the College Savings Plans of Nevada
- Expense ratios of the underlying ETFs used in the plan
As we saw previously, Wealthfront selects low-cost index-tracking ETFs for our 529 plan. The weighted-average expense ratios of the portfolios employed in the glide paths range from 0.06% to 0.14%, thus the total cost of managing your 529 account at Wealthfront is 0.37% to 0.45%. This compares extremely favorably to an average total cost of 0.82% (as of December 2023) for advisor-sold plans like Wealthfront’s, as reported in by Morningstar.
You can start a Wealthfront 529 plan with as little as $500.
Quantifying 529 Plan Benefits
In this section, we’ll attempt to quantify the benefit of the tax-free growth and superfunding available through 529 accounts, and of Wealthfront’s glide path methodology.
In each part, we use Monte-Carlo simulations of possible asset returns and calculate account values assuming a given sequence of contributions and a given sequence of portfolios (which could be either a glide path or a fixed portfolio allocation). At the end of each simulation, we calculate the funding ratio, which is the final account value divided by the total expected cost of college. The funding ratio is an easy-to-understand measure of how much of the total cost of education the account was able to cover in a given simulation. We report on several metrics related to the distribution of funding ratios across the 25,000 simulations:
- Average funding ratio is the average final funding ratio across the 25,000 simulations. A ratio of 1.0 means the account was sufficient to cover 100% of the projected cost.
- Success rate is the fraction of simulations where the funding ratio was at least 1.0
- Average shortfall is only measured in cases where the funding ratio was below 1.0, and measures the amount by which the portfolio value fell short of the goal. As an example, for a simulation where the account ended with $93,000 vs. a goal of $100,000, the shortfall value would be 7%.
Each case assumes the student plans to attend a four-year college with a current annual tuition of $35,000. Accounting for increases in the cost of education due to inflation, the total expected cost in 18 years is $308,260.
Tax Advantages
The tax-free growth, for qualified expenses, of 529 plans is the most effective advantage compared to saving in a fully taxable account. In this example, we compare using a 529 account vs. a taxable investment account to save for college. To keep the comparison as simple as possible, we assume the same sequences of deposits for each account type, and the same investment portfolios over the life of the account. We consider two different funding patterns: the “Superfunded” case assumes $190,000 deposited when the account begins, and no further deposits from then on. The “Gradually funded” case assumes a monthly deposit of $879.63 for 18 years, resulting in the same total funding amount of $190,000.
When considering a taxable account, we estimate the tax effect from two sources. The first is the tax due on dividends which are paid monthly or quarterly by the investments in the portfolio. The second, and much more impactful, is the tax due on realized gains when the account is liquidated to pay for tuition. For 529 accounts, all growth is tax-exempt for qualified expenses, so we don’t need to make any adjustments.
Table 2 shows some statistics related to the funding ratios. The results clearly show the substantial advantage that 529s enjoy over taxable accounts for education saving. Taxes reduce the average funding ratio from 1.96 to 1.47 in the superfunded case and from 1.13 to 0.95 in the gradually-funded case, and the success rates by more than 11 and 19 percentage points, respectively. In both cases, superfunding improves the average shortfall amount slightly as well.
Table 2: Comparison of 529 and Taxable Accounts
| SUPERFUNDED | GRADUALLY FUNDED | |||
| Metric | 529 Account | Taxable Account | 529 Account | Taxable Account |
| Average Funding Ratio | 1.96 | 1.47 | 1.13 | 0.95 |
| Success Rate | 77.8% | 66.2% | 54.6% | 35.5% |
| Average Shortfall | 27.2% | 28.1% | 20.7% | 22.5% |
Glide Paths
In this section, we’ll compare the glide path approach with a simpler method of keeping the allocation fixed throughout the life of the account. For the fixed portfolio approach, we use the portfolio that the risk score-8 glide path starts with and holds for just over 10 years before starting to de-risk. As with the prior section, we consider both superfunded and gradually-funded deposit patterns—with the same timing and dollar values as above.
Figure 2 shows histograms of the funding ratios achieved by each investment approach over the 25,000 simulations, for the gradual funding deposit pattern. The most important thing to notice is that the histogram for the Glide Path approach is “skinnier”—there are fewer instances of funding ratios much higher than one, but also fewer instances where the funding ratio is lower than one.
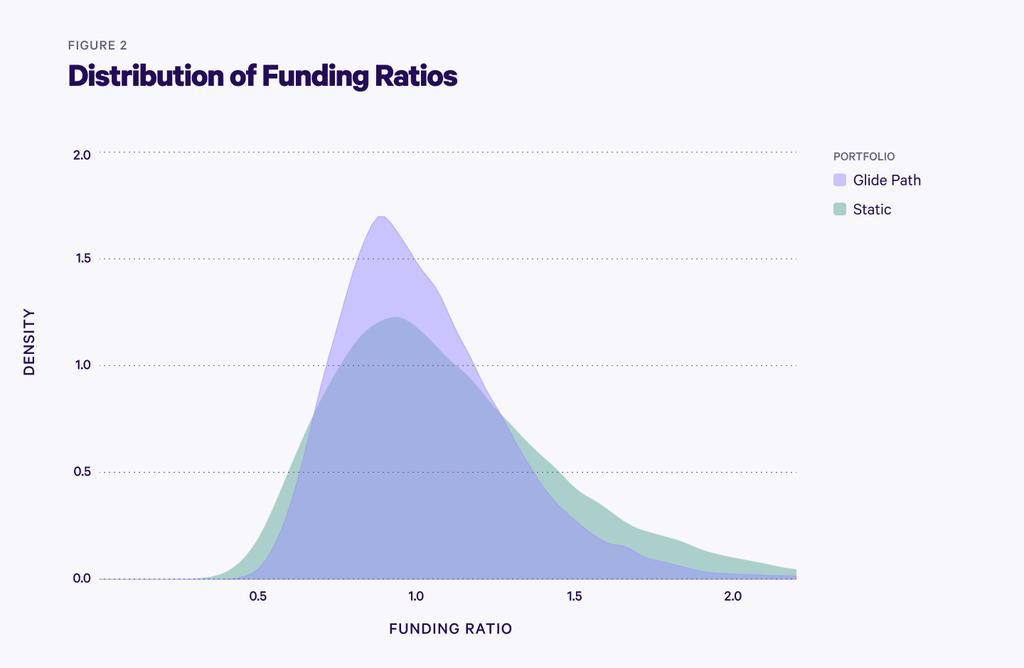
Table 3 shows additional metrics related to the funding ratios achieved by the varying approaches.
Table 3: Comparison of Glide Paths and Fixed Allocations
| SUPERFUNDED | GRADUALLY FUNDED | |||
| Metric | Glide Path | Fixed Allocation | Glide Path | Fixed Allocation |
| Average Funding Ratio | 1.96 | 2.13 | 1.13 | 1.22 |
| Success Rate | 77.8% | 76.6% | 54.6% | 56.9% |
| Average Shortfall | 27.2% | 30.1% | 20.7% | 25.4% |
The Fixed Allocation approach produced a higher Average Funding Ratio in both the Superfunded and Gradually Funded scenarios. The Glide Path approach produced a lower Average Shortfall in both scenarios, but its Success Rate was higher in the Superfunded scenario and lower in the Gradually Funded scenario. Under the assumptions used, the Glide Path reduced the severity of funding shortfalls. This is the intended result of employing glide paths. Their goal is to create a higher likelihood of positive outcomes which helps relieve the stress of funding your child or loved one’s education.
Superfunding
The two previous sections have shown there is a meaningful advantage to superfunding. In those comparisons, the gradual funding was much more gradual, so in this section we will introduce a middle ground between superfunding and monthly deposits for the full 18 years. Specifically, we’ll assume that the account gets deposits of $38,000 in the first month of each of the first five years of the account. The total contribution amount is the same as the super-funded case, but spread out over five years rather than all in the first month. We’ll refer to this case as “front-loaded”.
Table 4 shows the results of this comparison. As you might expect, the outcomes for the front-loaded case are between those of the superfunded and gradually-funded cases. Funding earlier generally results in higher funding ratios and a higher rate of success. Somewhat unintuitively, the average shortfall amount increases as the funding shifts earlier, from 20.7% in the gradual case to 25.9% in the front-loaded case and 27.2% with superfunding. This is a result of the amount of time money is “at risk” in each case. With gradual funding, there are meaningful deposits being made right through the 18th year of the account. The later a contribution comes, the less chance there is for the market to move significantly downward before the time of liquidation. As an extreme example, imagine funding the entire account with the full tuition cost one month before the end of the 18th year. The success rate might be lower in this case – in the short-term the market can go up or down, although it is slightly more likely to go up—but in cases where the market goes down and the funding ratio is below one, the shortfall is likely to be very small. In months where the US market is down, the average total return is only about -3.96%, which would correspond to an equally small shortfall value. So, while earlier funding gets your money in the market sooner, that money has a higher chance of seeing larger negative returns.
Table 4: Comparison of Funding Patterns
| Metric | Superfunded | Front-loaded | Gradual |
| Average Funding Ratio | 1.96 | 1.71 | 1.13 |
| Success Rate | 77.8% | 75.0% | 54.6% |
| Average Shortfall | 27.2% | 25.9% | 20.7% |
Conclusion
Wealthfront’s 529 College Savings Account offers a simple, automated approach to education savings. The tax-free growth and ability to superfund give 529 plans advantages relative to a traditional brokerage account, and Wealthfront’s glide path methodology automatically adjusts your portfolio over time to help increase the likelihood of meeting your education savings goals.
Disclosures:
This information is provided for general informational purposes, and should not be construed as investment or tax advice, solicitation or offer, or recommendation, of any security or account. Any links provided to other server sites are offered as a matter of convenience and are not intended to imply that Wealthfront Corporation or any of its affiliates endorses, sponsors, promotes and/or is affiliated with the owners of or participants in those sites, or endorses any information contained on those sites, unless expressly stated otherwise.
The produced results are based on Monte-Carlo simulations, are provided for informational and illustrative purposes, and do not represent actual account or client performance. They do not guarantee future results. Results depend materially on assumptions regarding asset-class returns, volatility, correlations, inflation, education-cost growth, taxes, fees, contribution timing, rebalancing and withdrawal timing. Actual results may differ. All investing involves risk, including the possible loss of money invested.
Investment management and advisory services are provided by Wealthfront Advisers LLC (“Wealthfront Advisers”), an SEC-registered investment adviser, and brokerage related products are provided by Wealthfront Brokerage LLC (“Wealthfront Brokerage”), a Member of FINRA/SIPC. Wealthfront Advisers and Wealthfront Brokerage are wholly owned subsidiaries of Wealthfront Corporation.
Advisory services are only provided to investors who become clients. Wealthfront Advisers does not represent in any manner that the tax consequences described will be obtained or will result in any particular tax consequence.
Wealthfront Advisers and its affiliates do not provide legal or tax advice and do not assume any liability for the tax consequences of any client transaction. Clients should consult with their personal tax advisors regarding the tax consequences of investing with Wealthfront Advisers and engaging in these tax strategies, based on their particular circumstances. Clients and their personal tax advisors are responsible for how the transactions conducted in an account are reported to the IRS or any other taxing authority on the investor’s personal tax returns.
Clients should also consult their financial or tax to learn more about how state-based benefits (or any limitations) would apply to their specific circumstances. Clients also may wish to directly contact their home state’s 529 plan(s), or any other 529 plan, to learn more about those plans’ features, benefits, and limitations. Keep in mind that state-based benefits should be one of many appropriately weighted factors to be considered when making an investment decision. Earnings on nonqualified expenses are subject to federal income tax and may be subject to a ten percent federal tax penalty, as well as state and local income taxes. The availability of tax and other benefits may be contingent on meeting other requirements.
The Wealthfront 529 College Savings Plan (the “Plan”) is administered by the Board of Trustees of the College Savings Plans of Nevada (the “Board”), chaired by the Nevada State Treasurer. Ascensus College Savings Recordkeeping Services, LLC, (ACSR) serves as the Program Manager. Wealthfront Advisers, serves as the investment adviser to the Plan. Wealthfront Brokerage, serves as the distributor and the underwriter of the Plan. Before you invest, consider whether your or the beneficiary’s home state offers any state tax or other state benefits such as financial aid, scholarship funds, and protection from creditors that are only available for investments in that state’s qualified tuition program.
For more information about the Plan, download the Plan Description and Participation Agreement or request one by calling 844-995-8437 or emailing support@wealthfront.com. Investment objectives, risks, charges, expenses, and other important information are included in the Plan Description and Participation Agreement; please read and consider it carefully before investing. An investment in the Plan is not insured or guaranteed by the FDIC or any federal or state government or agency. You could lose all or portion of your investment.
Copyright 2026 Wealthfront Corporation. All rights reserved.